Day 3 · About 6 hours, in three sessions
Intraday prices, tests and a package
Download a share’s 1-minute bars for a trading day and find its VWAP, write tests that catch a real bug, then tidy the project with Ruff, type hints and a package.
Today’s goal
By the end of today your project shows a share’s trading day in 1-minute bars: the day’s bar, its VWAP, when it traded most, and this chart:
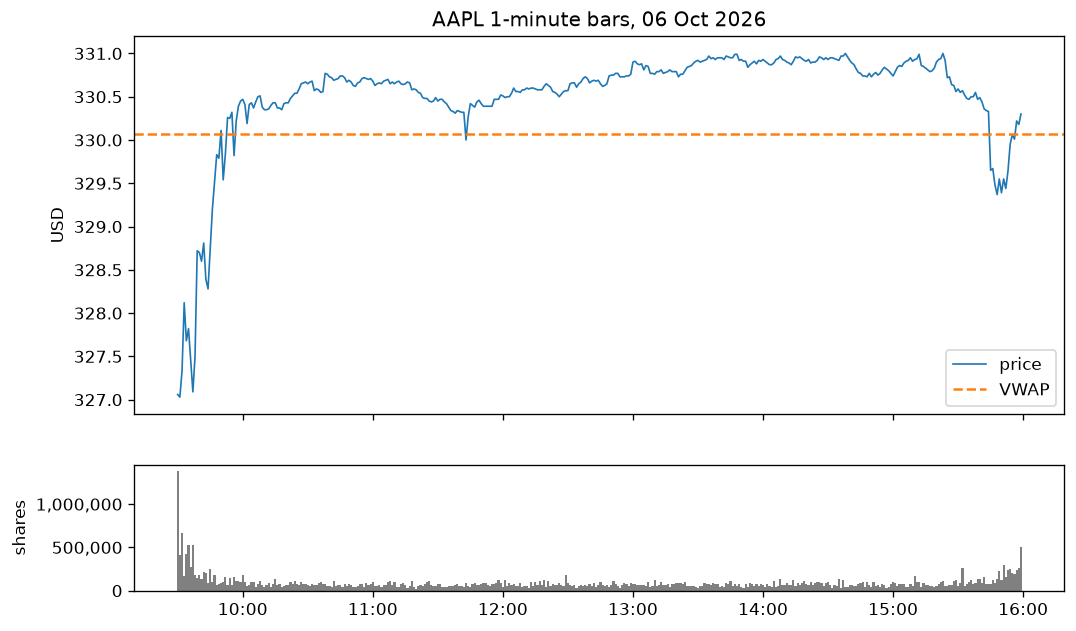
Twelve tests check your code each time you change it, Ruff keeps every file tidy, and the project is a package with its own commands:
uv run --env-file .env quote AAPLAAPL last 330.27 bid 330.25 ask 330.30 spread 0.05
Shown for the course’s sample data. Yours shows the latest.
Why it matters on a desk
Desks trade inside the day. A large order is split into small ones through the day and judged against the day’s VWAP, and risk is watched through the day. 1-minute bars are the first step from daily prices toward every single trade.
Code that moves money is tested. A bug in a split finder or a return doesn’t crash: it quietly gives a wrong number, and everything built on that number is wrong too. Tests are how you find out first, and how you know a change didn’t break what worked.
Review
A few questions from earlier days. Answer each before you start.
A share closed at 50.00 one day and at 55.00 the next. What was its return?
Show the answer
B: +10.00% A return is measured from the day before’s close: 55.00 ÷ 50.00 − 1 = 0.10, which is +10.00%.
On a log scale, which step is as tall as the step from 10 to 20?
Show the answer
C: 100 to 200 On a log scale equal steps are equal percent moves. 10 to 20 and 100 to 200 are both doublings.
A raw price history shows a fall of 75% in one day, and that day’s volume is about four times the day before’s. What is the likeliest reason?
Show the answer
A: A 4-for-1 split A 4-for-1 split divides the price by 4, a fall of 75%, and multiplies the shares, so the volume jumps too. No owner lost anything.
Session 1 1-minute bars and VWAP
The idea
Step 1 A day in minutes
Alpaca’s bars come in any length. Ask for 1Min and you get a bar for each minute, with its open, high, low, close, volume, number of trades and VWAP. The free plan has them for any trading day since 2016, up to 15 minutes ago.
Each bar is labelled by the minute it starts, in UTC. A day’s minutes are labelled 9:30 to 15:59 New York time: the 15:59 bar holds the last minute before the 16:00 close. New York is 4 hours behind UTC on daylight saving time, from March to early November, and 5 hours behind the rest of the year. On 6 October it was 4 hours behind, so the first minute was 13:30 in UTC.
| Field | From the minutes | 6 October’s minutes | Day 2’s daily bar |
|---|---|---|---|
| open | The first minute’s open | 327.10 | 327.10 |
| high | The highest of all the minutes’ highs | 331.05 | 331.05 |
| low | The lowest of all the minutes’ lows | 326.92 | 326.92 |
| close | The last minute’s close | 330.30 | 330.27 |
| volume | Every minute’s volume, added up | 35,475,267 | 41,250,310 |
The open, high and low match. The close doesn’t, because the day’s official close is set by the closing auction at 16:00, just after the last minute: the orders waiting for the close all trade at once, at one price, here 330.27. Alpaca puts the auction in a bar of its own, labelled 16:00.
The volume doesn’t match either, because the daily bar counts every trade of the day, not only the session’s:
| Trading | Shares |
|---|---|
| The session’s minutes, 9:30 to 15:59 | 35,475,267 |
| The closing auction at 16:00 | 4,950,037 |
| Before 9:30 | 825,006 |
| The daily bar’s volume | 35,475,267 + 4,950,037 + 825,006 = 41,250,310 |
Later in the evening the daily bar also counts trading after 16:00, which goes on until 20:00. The session’s minutes stay the same: they are the day’s main trading, and the place to measure it.
Practice
Problem 1
2 pointsIn one minute 3,000 shares traded, and the minute’s VWAP was 52.10. How many dollars’ worth of shares traded in it?
Hint 1
VWAP is the average price of every share traded in the minute.
Hint 2
Multiply the average price by the number of shares.
Solution
value = VWAP × shares
= 52.10 × 3,000
= 156,300.00 dollars
Problem 2
2 pointsIn a minute, 100 shares trade at 10.00 and 300 shares at 11.00. What is the minute’s VWAP?
Hint 1
Multiply each price by its shares, and add the two.
Hint 2
Divide by all the shares: 100 + 300 = 400.
Solution
price × shares: 10.00 × 100 + 11.00 × 300
= 1,000 + 3,300 = 4,300
VWAP = 4,300 ÷ 400 = 10.75
A day’s minute bars are listed in time order. Which of them gives the day’s high?
Show the answer
B: The highest of all the minutes’ highs The day’s high is the highest price paid at any time in the day, so it is the largest of the minutes’ highs. The first minute gives the open and the last the close.
Alpaca labels a minute 2026-10-06T19:59:00Z. New York is 4 hours behind UTC that day. Which minute is it?
Show the answer
B: 15:59 in New York, the day’s last minute New York is behind UTC, so take the 4 hours away: 19:59 − 4 hours = 15:59. Labelled by its start, it is the minute up to the 16:00 close.
The project, step by step
Build it yourself from this brief, then check it against the steps.
- Add
latest_day(symbol)andminute_bars(symbol, day)to alpaca.py: the date of the symbol’s latest daily bar, from its snapshot, and that day’s1Minbars from 09:30 to 15:59 New York time, or to 15 minutes ago if that is sooner. - Write intraday.py. It turns a ticker’s minutes, AAPL if none is given, into a DataFrame of open, high, low, close, volume and VWAP, indexed by each minute’s start in New York time.
- It prints how many minutes there are with the first and last time, the day’s bar built from its minutes, and the day’s VWAP from each minute’s own.
- It prints the shares traded in each hour on the clock, with a bar of # signs scaled to the busiest hour.
- It saves the minutes to the data folder and a chart of the price and its VWAP, above each minute’s volume, to the charts folder, each named for the ticker and the date, such as AAPL-2026-10-06.
Step 1 1-minute bars in the Alpaca client
Add two functions to alpaca.py: the latest day a symbol traded, and a day’s minute bars. The new and changed lines are marked:
alpaca.py"""Alpaca's market data: snapshots, daily bars and 1-minute bars. Snapshots are 15 minutes behind the market and cover every US exchange. The freeplan has bars since 2016, up to 15 minutes ago. The data is for personal use.""" import osfrom datetime import datetime, time, timedeltafrom functools import lru_cachefrom zoneinfo import ZoneInfo import httpx2 BASE_URL = "https://data.alpaca.markets"# The market's time zone. Alpaca gives every time in UTC.NEW_YORK = ZoneInfo("America/New_York")# The free plan's full-market data ends 15 minutes before now.DELAY = timedelta(minutes=15) @lru_cachedef client(): """One client for every request to Alpaca, made the first time it is needed: it keeps its connection open between requests and sends your keys with each.""" keys = { "APCA-API-KEY-ID": os.environ["APCA_API_KEY_ID"], "APCA-API-SECRET-KEY": os.environ["APCA_API_SECRET_KEY"], } return httpx2.Client(base_url=BASE_URL, headers=keys, timeout=10) def get(path, params): """GET a path with its query and return the JSON.""" response = client().get(path, params=params) response.raise_for_status() return response.json() def snapshots(symbols): """Each symbol's latest trade, quote and daily bars, 15 minutes behind.""" query = {"symbols": ",".join(symbols), "feed": "delayed_sip"} return get("/v2/stocks/snapshots", query) def bars(symbol, query): """A symbol's bars, oldest first, following Alpaca's pages to the last.""" query = {"symbols": symbol, "feed": "sip", "limit": 10000, **query} found = [] while True: page = get("/v2/stocks/bars", query) found += page["bars"].get(symbol, []) if not page["next_page_token"]: return found query["page_token"] = page["next_page_token"] def day_of(timestamp): """The New York date of one of Alpaca's UTC times.""" return datetime.fromisoformat(timestamp).astimezone(NEW_YORK).date() def daily_bars(symbol): """Every trading day's bar since 2016, adjusted for splits.""" query = {"timeframe": "1Day", "start": "2016-01-01", "adjustment": "split"} return bars(symbol, query) def latest_day(symbol): """The latest day the symbol traded: today once it has, or the last day it did. None if Alpaca has no such symbol.""" snapshot = snapshots([symbol]).get(symbol) return day_of(snapshot["dailyBar"]["t"]) if snapshot else None def minute_bars(symbol, day): """A day's 1-minute bars, from 09:30 New York time to the last minute before 16:00, or to 15 minutes ago if that is sooner. Each is labelled by its start.""" opening = datetime.combine(day, time(9, 30), NEW_YORK) last = datetime.combine(day, time(15, 59), NEW_YORK) end = min(last, datetime.now(NEW_YORK) - DELAY) # A day still to come has no minutes yet, and Alpaca refuses to be asked for them. if end < opening: return [] query = {"timeframe": "1Min", "start": opening.isoformat(), "end": end.isoformat()} return bars(symbol, query)- Line 8
timeis a time of day, such as 9:30, andtimedeltaa length of time, such as 15 minutes.- Line 18
- The free plan’s bars end 15 minutes before now. Asking for later ones is refused.
- Lines 68 to 72
- A snapshot’s daily bar is the latest day the symbol traded: today once the market has opened, or the last trading day before.
.get(symbol)gives the symbol’s snapshot, or None if Alpaca left it out because it doesn’t know the ticker; then the function gives None too.x if condition else yis x when the condition is true, and y when it isn’t. - Lines 75 to 85
datetime.combinejoins a date and a time of day in New York. Since each bar is labelled by its start, 09:30 is the first minute and 15:59 the last. The end is whichever is sooner, 15:59 or 15 minutes ago, so the request works during the day too. A day still to come would end before it starts, and Alpaca refuses that request, so the function gives no bars without asking.isoformat()writes each time with its offset from UTC, such as 2026-10-06T09:30:00-04:00, which Alpaca reads.
Step 2 Download a day of minutes
Make intraday.py beside your other files:
intraday.pyfrom pprint import pprint import alpaca day = alpaca.latest_day("AAPL")bars = alpaca.minute_bars("AAPL", day)print(day)pprint(bars[0])pprint(bars[-1])print(len(bars), "minutes")- Line 1
pprint, short for pretty-print, prints a dictionary across lines so it is easy to read.- Line 5
- The latest day Apple traded.
- Line 6
- That day’s 1-minute bars, a dictionary each.
- Line 7
- Print the day.
- Lines 8 to 9
- Print the first minute and the last.
- Line 10
- How many minutes the day has.
uv run --env-file .env intraday.py2026-10-06{'c': 327.06, 'h': 327.12, 'l': 326.98, 'n': 13916, 'o': 327.1, 't': '2026-10-06T13:30:00Z', 'v': 1387010, 'vw': 326.988}{'c': 330.3, 'h': 330.3, 'l': 330.13, 'n': 4858, 'o': 330.18, 't': '2026-10-06T19:59:00Z', 'v': 507952, 'vw': 330.2096}390 minutes
Shown for the course’s sample data. Yours shows the latest.
The names are the daily bars’ from Day 2. The first minute is labelled 13:30 in UTC and the last 19:59: take away the 4 hours New York was behind, and they are 9:30 and 15:59 there.
pprintsorts the names alphabetically.Step 3 The day’s bar, and its VWAP
Replace intraday.py with this:
intraday.pyimport pandas as pd import alpaca # Alpaca's short names for a bar's fields, and the names this project uses.COLUMNS = {"o": "open", "h": "high", "l": "low", "c": "close", "v": "volume", "vw": "vwap"} def get_minutes(symbol, day=None): """A day's 1-minute bars, oldest first, labelled by their start in New York time: the latest day the symbol traded, if no day is given. Empty if Alpaca has no such symbol, or the market wasn't open that day.""" day = day or alpaca.latest_day(symbol) bars = alpaca.minute_bars(symbol, day) if day else [] minutes = pd.DataFrame(bars, columns=list(COLUMNS)).rename(columns=COLUMNS) times = pd.to_datetime([bar["t"] for bar in bars], utc=True) minutes.index = times.tz_convert(alpaca.NEW_YORK).rename("time") return minutes def day_bar(minutes): """The whole day as one bar, built from its minutes.""" return { "open": minutes["open"].iloc[0], "high": minutes["high"].max(), "low": minutes["low"].min(), "close": minutes["close"].iloc[-1], "volume": minutes["volume"].sum(), } def vwap(minutes): """The day's volume-weighted average price, from each minute's own.""" traded = (minutes["vwap"] * minutes["volume"]).sum() return traded / minutes["volume"].sum() minutes = get_minutes("AAPL")print(minutes.head())first, last = minutes.index[0], minutes.index[-1]print(f"\n{len(minutes)} minutes on {first:%d %b %Y}, {first:%H:%M} to {last:%H:%M}\n")bar = day_bar(minutes)for field in ("open", "high", "low", "close"): print(f"{field:<8}{bar[field]:.2f}")print(f"{'volume':<8}{bar['volume']:,}")print(f"{'VWAP':<8}{vwap(minutes):.2f}")- Line 6
- Alpaca’s short names and this project’s, for the six columns the day’s code uses, VWAP among them.
- Lines 9 to 14
day=Nonemakes the day optional.day or alpaca.latest_day(symbol)gives the day if there is one and the latest day if not:orgives its left side unless that is None or empty, and its right side otherwise. With no day, for a ticker Alpaca doesn’t know, there are no bars to ask for.- Line 15
- A table of the six columns, renamed, as in history.py: empty, with those columns, when there are no bars.
- Line 16
pd.to_datetimeturns each minute’s time from text into a time, andutc=Truesays it is in UTC.- Line 17
tz_convert(alpaca.NEW_YORK)gives the same moments in New York’s time, and they become the index, namedtime.- Lines 21 to 29
- The day’s bar, built from its minutes, as a dictionary: the first open, the highest high, the lowest low, the last close, and all the volume.
- Lines 32 to 35
- Each minute’s VWAP times its volume is the dollars traded in it. All of those added up, divided by the day’s volume, is the day’s VWAP.
- Lines 38 to 39
- Fetch Apple’s latest day and print its first five minutes.
- Lines 40 to 41
:%H:%Mwrites a time as hours and minutes. The\nat the end adds an empty line.- Lines 42 to 46
- Print the bar, a line a field.
:<8puts the name on the left of 8 characters so the numbers line up, and:,writes the volume with commas.
uv run --env-file .env intraday.py open high low close volume vwaptime 2026-10-06 09:30:00-04:00 327.10 327.12 326.98 327.06 1387010 326.98802026-10-06 09:31:00-04:00 327.07 327.16 326.92 327.03 412865 327.05082026-10-06 09:32:00-04:00 327.00 327.39 326.94 327.33 662994 327.11742026-10-06 09:33:00-04:00 327.27 328.14 326.92 328.12 165904 327.61882026-10-06 09:34:00-04:00 328.16 328.42 327.29 327.68 426293 327.7113 390 minutes on 06 Oct 2026, 09:30 to 15:59 open 327.10high 331.05low 326.92close 330.30volume 35,475,267VWAP 330.06
Shown for the course’s sample data. Yours shows the latest.
Each time ends with its offset from UTC:
-04:00is 4 hours behind it. The open, high and low are Day 2’s daily bar for 6 October; the close and the volume aren’t, for the reasons in the board’s first act.Step 4 When the shares traded, and a chart
Replace intraday.py with the finished file:
intraday.py"""A trading day's 1-minute bars: the day's bar, its VWAP and volume by hour. Run it with a ticker, such as: uv run --env-file .env intraday.py AAPL""" import sysfrom pathlib import Path import matplotlib.dates as mdatesimport matplotlib.pyplot as pltimport pandas as pdfrom matplotlib import ticker import alpaca # Alpaca's short names for a bar's fields, and the names this project uses.COLUMNS = {"o": "open", "h": "high", "l": "low", "c": "close", "v": "volume", "vw": "vwap"} def get_minutes(symbol, day=None): """A day's 1-minute bars, oldest first, labelled by their start in New York time: the latest day the symbol traded, if no day is given. Empty if Alpaca has no such symbol, or the market wasn't open that day.""" day = day or alpaca.latest_day(symbol) bars = alpaca.minute_bars(symbol, day) if day else [] minutes = pd.DataFrame(bars, columns=list(COLUMNS)).rename(columns=COLUMNS) times = pd.to_datetime([bar["t"] for bar in bars], utc=True) minutes.index = times.tz_convert(alpaca.NEW_YORK).rename("time") return minutes def day_bar(minutes): """The whole day as one bar, built from its minutes.""" return { "open": minutes["open"].iloc[0], "high": minutes["high"].max(), "low": minutes["low"].min(), "close": minutes["close"].iloc[-1], "volume": minutes["volume"].sum(), } def vwap(minutes): """The day's volume-weighted average price, from each minute's own.""" traded = (minutes["vwap"] * minutes["volume"]).sum() return traded / minutes["volume"].sum() def volume_by_hour(minutes): """The shares traded in each hour on the clock: 9 is the first half hour.""" return minutes["volume"].groupby(minutes.index.hour).sum() def chart(minutes, symbol, path): """The price and its VWAP above, each minute's volume below, saved as a picture.""" fig, (top, bottom) = plt.subplots( 2, 1, figsize=(10, 6), sharex=True, height_ratios=[3, 1] ) top.plot(minutes.index, minutes["close"], linewidth=1, label="price") top.axhline(vwap(minutes), color="tab:orange", linestyle="--", label="VWAP") top.set_title(f"{symbol} 1-minute bars, {minutes.index[0]:%d %b %Y}") top.set_ylabel("USD") top.legend() bottom.bar(minutes.index, minutes["volume"], width=1 / (24 * 60), color="gray") bottom.set_ylabel("shares") bottom.yaxis.set_major_formatter(ticker.StrMethodFormatter("{x:,.0f}")) bottom.xaxis.set_major_formatter(mdates.DateFormatter("%H:%M", tz=alpaca.NEW_YORK)) fig.savefig(path, dpi=120, bbox_inches="tight") if __name__ == "__main__": symbol = sys.argv[1] if len(sys.argv) > 1 else "AAPL" minutes = get_minutes(symbol) if minutes.empty: sys.exit(f"No minutes for {symbol}: check the ticker.") first, last = minutes.index[0], minutes.index[-1] print(f"{len(minutes)} minutes on {first:%d %b %Y}, {first:%H:%M} to {last:%H:%M}\n") bar = day_bar(minutes) for field in ("open", "high", "low", "close"): print(f"{field:<8}{bar[field]:.2f}") print(f"{'volume':<8}{bar['volume']:,}") print(f"{'VWAP':<8}{vwap(minutes):.2f}") hours = volume_by_hour(minutes) print("\nhour shares") for hour, shares in hours.items(): print(f"{hour:>4}{shares:>12,} {'#' * round(30 * shares / hours.max())}") Path("data").mkdir(exist_ok=True) Path("charts").mkdir(exist_ok=True) day = f"{symbol}-{first:%Y-%m-%d}" minutes.to_csv(f"data/{day}.csv") chart(minutes, symbol, f"charts/{day}.png") print(f"\nsaved data/{day}.csv and charts/{day}.png")- Lines 1 to 6
- The docstring: what the file does and how to run it.
- Lines 8 to 14
- New imports:
sysandPathas in history.py,matplotlib.dates(asmdates) for writing times on the chart,pyplotfor drawing, andtickerfor the volume’s labels. - Lines 51 to 53
minutes.index.houris each minute’s hour on the clock, 9 to 15.groupbysorts the volumes into a group for each hour, andsum()adds up each group.- Lines 56 to 59
- A figure with two charts, one above the other, sharing their time axis (
sharex). The top one is three times as tall as the bottom one. - Lines 61 to 65
- The top chart: the price each minute, the VWAP as a dashed line across the whole chart (
axhline, a horizontal line), a title, a label, and a key to the two lines (legend). - Lines 66 to 69
- The bottom chart: a bar for each minute’s volume. matplotlib measures dates in days, so a minute is 1 ÷ (24 × 60) of one. The volume is labelled with commas, and the times as hours and minutes in New York time.
- Lines 73 to 75
- Only when the file is run: take the ticker from the command line, AAPL if there is none, and fetch its latest day.
- Lines 76 to 77
- No minutes means Alpaca doesn’t know the ticker: say so and stop, as quote.py does.
- Lines 85 to 88
- A row for each hour: the shares, and
#repeated in proportion to them.'#' * 30is 30 of them, given to the busiest hour. - Lines 89 to 94
- Save the minutes and the chart, named for the ticker and the day, so each day you save is kept beside the others.
uv run --env-file .env intraday.py AAPL390 minutes on 06 Oct 2026, 09:30 to 15:59 open 327.10high 331.05low 326.92close 330.30volume 35,475,267VWAP 330.06 hour shares 9 7,283,943 ############################## 10 4,416,980 ################## 11 4,075,449 ################# 12 4,254,461 ################## 13 4,104,627 ################# 14 4,322,845 ################## 15 7,016,962 ############################# saved data/AAPL-2026-10-06.csv and charts/AAPL-2026-10-06.png
Shown for the course’s sample data. Yours shows the latest.
Shown for the course’s sample data. Yours shows the latest. The first minute’s bar towers over the rest: it holds the opening auction, where the orders that built up overnight trade at one price. The closing auction at 16:00 is bigger still, but it falls after the last of these minutes. Run it after the market closes and you get the whole day; run it during the day and you get the day so far, up to 15 minutes ago.
Step 5 Commit your work
git status --short M alpaca.py?? intraday.pygit add alpaca.py intraday.pygit commit -m "Add intraday bars: day bar, VWAP and volume by hour"[main 68d77cf] Add intraday bars: day bar, VWAP and volume by hour 2 files changed, 118 insertions(+), 2 deletions(-) create mode 100644 intraday.py
The commit holds alpaca.py and intraday.py. The minutes and the chart went into the data and charts folders, which Git leaves out.
Session 2 Tests with pytest
The idea
Step 1 A test
A test is a small function that runs your code on inputs whose answer you already know, and checks that the code gives that answer. If it doesn’t, the test fails and says where.
pytest is the package most Python code is tested with. It finds every file whose name starts with test_ and every function in it whose name starts with test, runs them, and reports each one: a dot for a pass, an F for a failure.
assert is Python’s check. assert total_return(close) == -0.01 does nothing when it is true, and stops the test with an error when it is false.
Tests use small made-up data you can work out on paper. Then they run in a moment, give the same result every time, and need no internet. A test that downloaded today’s prices would pass or fail with the market.
Practice
Problem 3
2 pointsA test gives total_return the closes 200.00, 220.00, 198.00. What answer should it expect, in percent?
Hint 1
The total return is the last close ÷ the first − 1.
Hint 2
Multiply by 100 for a percent.
Solution
total return = 198.00 ÷ 200.00 − 1
= 0.99 − 1 = −0.01
= −1.0%
Problem 4
2 pointsA share at 80.00 splits 2 for 1, and on the same day rises 5%. What is its raw return that day, in percent?
Hint 1
After the split, each share is worth 80.00 ÷ 2 = 40.00. Then it rises 5%.
Hint 2
The raw return is the new close ÷ the old one − 1.
Solution
close after = 80.00 ÷ 2 × 1.05 = 42.00
raw return = 42.00 ÷ 80.00 − 1 = −0.475
= −47.5%
Not below −50%, but below −40%: the fixed finder catches it.
Why does a test compare decimals with pytest.approx rather than ==?
Show the answer
B: Most decimals can’t be stored exactly, so a right answer can be a hair off Decimals are stored in binary, so 0.1 + 0.2 comes out as 0.30000000000000004. approx accepts a difference of up to a millionth of the expected value.
Why do tests use small made-up prices rather than today’s prices from Alpaca?
Show the answer
C: So they run fast, give the same answer every time, and need no internet A test must give the same answer every time the code is right. Today’s prices change, need the internet and your keys, and have answers you can’t work out on paper in advance.
The project, step by step
Build it yourself from this brief, then check it against the steps.
- Add pytest to the project as a development tool.
- Write test_returns.py, with tests of daily_returns, total_return, yearly_growth and calendar_years, each on a few made-up closes whose answers you can work out on paper.
- Write test_adjust.py. Test that find_splits finds a 2-for-1 split on a day the share rose a little, and ignores an ordinary fall. Test that adjust divides prices and multiplies volume before a split, and leaves the raw table alone. Test that total_returns counts a dividend.
- Write test_intraday.py, with tests of day_bar, vwap and volume_by_hour on three made-up minutes.
- Run them with
uv run pytest, fix what fails, and commit.
Step 1 Add pytest
uv add --dev pytestResolved 27 packages in 193msDownloading pygments (1.2MiB) Downloaded pygmentsPrepared 4 packages in 123msInstalled 4 packages in 51ms + iniconfig==2.3.1 + pluggy==1.6.0 + pygments==2.21.0 + pytest==9.1.1cat pyproject.toml[project]name = "market-data"version = "0.1.0"description = "US equity market data in Python"readme = "README.md"requires-python = ">=3.14"dependencies = [ "httpx2>=2.13.1", "matplotlib>=3.11.2", "pandas>=3.0.6",] [dependency-groups]dev = [ "pytest>=9.1.1",]
--devmakes pytest a development dependency: a tool for working on the project, not something its code needs to run. uv lists it apart, under[dependency-groups].Step 2 Your first tests
Make test_returns.py beside returns.py:
test_returns.pyimport pandas as pdimport pytest from returns import daily_returns, total_return def test_daily_returns(): close = pd.Series([100.0, 110.0, 99.0]) assert daily_returns(close).tolist() == pytest.approx([0.10, -0.10]) def test_total_return_compounds(): close = pd.Series([100.0, 110.0, 99.0]) assert total_return(close) == pytest.approx(-0.01)- Line 2
- Load pytest, for
pytest.approx. - Line 4
- The functions to test, from returns.py beside the test.
- Lines 7 to 9
- Closes of 100, 110 and 99 have returns of +0.10 and −0.10, worked out on paper.
tolist()turns the Series into a plain list, andpytest.approxcompares each decimal give or take a millionth. - Lines 12 to 14
- Up 10% and down 10% is 99 ÷ 100 − 1 = −0.01: a test that returns multiply, not add.
uv run pytest============================= test session starts ==============================platform linux -- Python 3.14.8, pytest-9.1.1, pluggy-1.6.0rootdir: /home/you/market-dataconfigfile: pyproject.tomlplugins: anyio-4.15.1collected 2 items test_returns.py .. [100%] ============================== 2 passed in 1.82s ===============================
pytest found the test file, ran its 2 tests, and printed a dot for each pass. The lines above say which Python and pytest ran, and where.
Step 3 Test the split finder
Add two more tests to test_returns.py:
test_returns.pyimport pandas as pdimport pytest from returns import calendar_years, daily_returns, total_return, yearly_growth def test_daily_returns(): close = pd.Series([100.0, 110.0, 99.0]) assert daily_returns(close).tolist() == pytest.approx([0.10, -0.10]) def test_total_return_compounds(): close = pd.Series([100.0, 110.0, 99.0]) assert total_return(close) == pytest.approx(-0.01) def test_yearly_growth_compounds_back_to_the_total(): dates = pd.to_datetime(["2020-01-01", "2022-01-01"]) close = pd.Series([100.0, 200.0], index=dates) years = 731 / 365.25 # 2020 had 366 days, 2021 had 365 assert (1 + yearly_growth(close)) ** years == pytest.approx(2.0) def test_calendar_years_start_from_the_year_before(): dates = pd.to_datetime(["2024-06-03", "2024-12-31", "2025-06-02", "2025-12-31"]) close = pd.Series([90.0, 100.0, 130.0, 120.0], index=dates) years = calendar_years(close) assert years.index.year.tolist() == [2025] assert years.tolist() == pytest.approx([0.20])- Lines 17 to 21
- Doubling in exactly 731 days, 2020 and 2021. Growth a year, compounded over 731 ÷ 365.25 years, must give back 2: the test checks the answer by undoing it.
- Lines 24 to 29
- Two years ending on 100 and 120. 2025’s return is 120 ÷ 100 − 1 = 0.20, and 2024 has no year before it, so it is left out.
Then make test_adjust.py:
test_adjust.pyimport pandas as pdimport pytest from adjust import adjust, find_splits, total_returns DAYS = pd.to_datetime(["2026-03-02", "2026-03-03", "2026-03-04"]) def raw_prices(): """Three days of a share that split 2 for 1 on the second day.""" return pd.DataFrame( {"close": [100.0, 51.0, 52.0], "volume": [1000, 2200, 1800], "dividend": 0.0}, index=DAYS, ) def test_find_splits_finds_a_2_for_1(): assert find_splits(raw_prices()["close"]) == {DAYS[1]: 2} def test_find_splits_ignores_an_ordinary_fall(): close = pd.Series([100.0, 90.0, 95.0], index=DAYS) assert find_splits(close) == {} def test_adjust_divides_prices_and_multiplies_volume_before_the_split(): adjusted = adjust(raw_prices(), {DAYS[1]: 2}) assert adjusted["close"].tolist() == [50.0, 51.0, 52.0] assert adjusted["volume"].tolist() == [2000, 2200, 1800] def test_adjust_leaves_the_raw_prices_alone(): raw = raw_prices() adjust(raw, {DAYS[1]: 2}) assert raw["close"].tolist() == [100.0, 51.0, 52.0] def test_total_returns_count_the_dividend(): close = pd.Series([50.0, 49.75], index=DAYS[:2]) dividend = pd.Series([0.0, 0.5], index=DAYS[:2]) assert total_returns(close, dividend).tolist() == pytest.approx([0.005])- Line 6
- Three dates the tests share.
- Lines 9 to 13
- Three days of a share that split 2 for 1 on the second day, a day it also rose 2%: 100 ÷ 2 × 1.02 = 51. A function builds a fresh table for each test, so no test can change another’s data.
- Lines 17 to 18
- The case to be sure of: a 2-for-1 split on a day the share rose.
- Lines 21 to 23
- A fall of 10% is not a split.
- Lines 26 to 29
- Before the split 100 becomes 50 and 1,000 shares become 2,000; after it nothing changes.
- Lines 32 to 35
- Adjusting must not change the raw table it was given.
- Lines 38 to 41
- From 50.00 to 49.75 with a 0.50 dividend: (49.75 + 0.50) ÷ 50.00 − 1 = 0.005.
uv run pytest============================= test session starts ==============================platform linux -- Python 3.14.8, pytest-9.1.1, pluggy-1.6.0rootdir: /home/you/market-dataconfigfile: pyproject.tomlplugins: anyio-4.15.1collected 9 items test_adjust.py F.... [ 55%]test_returns.py .... [100%] =================================== FAILURES ===================================_______________________ test_find_splits_finds_a_2_for_1 _______________________ def test_find_splits_finds_a_2_for_1():> assert find_splits(raw_prices()["close"]) == {DAYS[1]: 2}E AssertionError: assert {} == {Timestamp('2...00:00:00'): 2}E E Right contains 1 more item:E {Timestamp('2026-03-03 00:00:00'): 2}E Use -v to get more diff test_adjust.py:18: AssertionError=========================== short test summary info ============================FAILED test_adjust.py::test_find_splits_finds_a_2_for_1 - AssertionError: ass...========================= 1 failed, 8 passed in 0.48s ==========================
One test failed. pytest shows the line that failed, marked with >, and what it compared:
find_splitsreturned{}, an empty dictionary, where the test expected the second day with a ratio of 2. The split finder missed the split.Step 4 Fix the bug
In adjust.py, change the line to a fall of more than 40%, and say why in the comment:
adjust.py"""Find a split in raw prices, adjust for it, and count the dividends in. Run it with the raw sample in data/split-sample.csv and your prices in data/AAPL.csv: uv run adjust.py""" import pandas as pd # A 2-for-1 split halves the price, and the share may rise a little that day too:# a fall of more than 40% in a day is almost always a split, not a crash.SPLIT_MOVE = -0.4 def find_splits(close): """Days the close fell by more than 40%, each with its split's ratio.""" returns = close.pct_change() days = returns[returns < SPLIT_MOVE].index return {day: round(close.shift(1)[day] / close[day]) for day in days} def adjust(prices, splits): """Divide every price and dividend before a split by its ratio; multiply volume.""" adjusted = prices.copy() for day, ratio in splits.items(): before = adjusted.index < day adjusted.loc[before, ["close", "dividend"]] /= ratio adjusted.loc[before, "volume"] *= ratio return adjusted def total_returns(close, dividend): """Each day's return with that day's dividend counted in.""" return ((close + dividend) / close.shift(1) - 1).dropna() if __name__ == "__main__": raw = pd.read_csv("data/split-sample.csv", index_col="date", parse_dates=True) splits = find_splits(raw["close"]) for day, ratio in splits.items(): print(f"split on {day:%d %b %Y}: {ratio} for 1") prices = adjust(raw, splits) close = prices["close"] price_return = close.iloc[-1] / close.iloc[0] - 1 total = (1 + total_returns(close, prices["dividend"])).prod() - 1 print(f"from {close.iloc[0]:.4f} to {close.iloc[-1]:.4f}") print(f"price return: {price_return:+.2%}") print(f"total return, with dividend: {total:+.2%}") mine = pd.read_csv("data/AAPL.csv", index_col="date", parse_dates=True) print(f"splits in data/AAPL.csv: {len(find_splits(mine['close']))}")- Lines 10 to 12
- The new line, with the reason beside it, so nobody sets it back to −0.5.
- Line 16
- The docstring says the same.
uv run pytest============================= test session starts ==============================platform linux -- Python 3.14.8, pytest-9.1.1, pluggy-1.6.0rootdir: /home/you/market-dataconfigfile: pyproject.tomlplugins: anyio-4.15.1collected 9 items test_adjust.py ..... [ 55%]test_returns.py .... [100%] ============================== 9 passed in 0.48s ===============================
Step 5 Test the day’s minutes
Make test_intraday.py:
test_intraday.pyimport pandas as pdimport pytest from intraday import day_bar, volume_by_hour, vwap TIMES = pd.to_datetime(["2026-10-06 09:30", "2026-10-06 09:31", "2026-10-06 10:00"]) def three_minutes(): """Three minutes, two in the first half hour and one after 10:00.""" return pd.DataFrame( { "open": [10.0, 11.0, 12.0], "high": [11.0, 12.0, 13.0], "low": [9.0, 10.0, 11.0], "close": [10.0, 11.0, 12.0], "volume": [100, 100, 200], "vwap": [10.2, 11.1, 12.0], }, index=TIMES, ) def test_day_bar_is_built_from_its_minutes(): bar = day_bar(three_minutes()) assert bar == {"open": 10.0, "high": 13.0, "low": 9.0, "close": 12.0, "volume": 400} def test_vwap_weights_each_minute_by_its_volume(): # (10.2 × 100 + 11.1 × 100 + 12 × 200) ÷ 400 = 4530 ÷ 400 = 11.325. assert vwap(three_minutes()) == pytest.approx(11.325) def test_volume_by_hour_adds_up_each_hour(): hours = volume_by_hour(three_minutes()) assert hours.to_dict() == {9: 200, 10: 200}- Line 6
- Three minutes, labelled by their start: two in the first half hour, and one at 10:00.
- Lines 9 to 20
- Their VWAPs are 10.20, 11.10 and 12.00, with 100, 100 and 200 shares.
- Lines 24 to 26
- The first open, the highest high, the lowest low, the last close and all the volume.
- Lines 29 to 31
- Worked out in the comment: (10.2 × 100 + 11.1 × 100 + 12 × 200) ÷ 400 = 4530 ÷ 400 = 11.325. A comment, after #, is a note for people; Python skips it.
- Lines 34 to 36
- 200 shares in hour 9 and 200 in hour 10.
to_dict()turns the Series into a dictionary to compare.
Run every test with
-v, verbose, which names each one, then commit:uv run pytest -v============================= test session starts ==============================platform linux -- Python 3.14.8, pytest-9.1.1, pluggy-1.6.0 -- /home/you/market-data/.venv/bin/pythoncachedir: .pytest_cacherootdir: /home/you/market-dataconfigfile: pyproject.tomlplugins: anyio-4.15.1collecting ... collected 12 items test_adjust.py::test_find_splits_finds_a_2_for_1 PASSED [ 8%]test_adjust.py::test_find_splits_ignores_an_ordinary_fall PASSED [ 16%]test_adjust.py::test_adjust_divides_prices_and_multiplies_volume_before_the_split PASSED [ 25%]test_adjust.py::test_adjust_leaves_the_raw_prices_alone PASSED [ 33%]test_adjust.py::test_total_returns_count_the_dividend PASSED [ 41%]test_intraday.py::test_day_bar_is_built_from_its_minutes PASSED [ 50%]test_intraday.py::test_vwap_weights_each_minute_by_its_volume PASSED [ 58%]test_intraday.py::test_volume_by_hour_adds_up_each_hour PASSED [ 66%]test_returns.py::test_daily_returns PASSED [ 75%]test_returns.py::test_total_return_compounds PASSED [ 83%]test_returns.py::test_yearly_growth_compounds_back_to_the_total PASSED [ 91%]test_returns.py::test_calendar_years_start_from_the_year_before PASSED [100%] ============================== 12 passed in 2.07s ==============================git add .git commit -m "Test returns, splits and the day's minutes, and fix the split finder"[main d33b284] Test returns, splits and the day's minutes, and fix the split finder 6 files changed, 175 insertions(+), 3 deletions(-) create mode 100644 test_adjust.py create mode 100644 test_intraday.py create mode 100644 test_returns.py
Session 3 Tidy code: Ruff, type hints and a package
The idea
Step 1 Ruff: one style, fewer mistakes
Ruff is a fast tool that does two jobs. ruff format is a formatter: it lays every file out one way (spacing, quotes, line breaks) without changing what the code does. ruff check is a linter: it reads code for patterns that run but are likely mistakes, such as an import never used, or a time with no time zone.
Formatted code reads the same in every file, so a change shows up in git diff as the change itself, not as someone’s spacing. Run both before each commit.
Today the linter finds DTZ005 in the watchlist: datetime.now() gives your computer’s time with no time zone attached. Markets run on New York time, so the watchlist asks for New York’s clock by name.
Practice
Which command changes how code looks without changing what it does?
Show the answer
C: ruff format ruff format lays the code out one way and never changes what it does. ruff check looks for likely mistakes, and uv sync installs the project.
In def vwap(minutes: pd.DataFrame) -> float:, what does -> float say?
Show the answer
A: The function returns a float The hint after the brackets is what the function returns. Python doesn’t convert or check anything: the hint is for readers and tools.
After the move into the package, how does a test import total_return?
Show the answer
B: from market_data.returns import total_return Once installed, every module is imported by the package’s name and its own: market_data.returns.
The project, step by step
Build it yourself from this brief, then check it against the steps.
- Add Ruff as a development tool, format the project with
uv run ruff format, and fix whatuv run ruff checkfinds. - Add type hints to every function: what each argument is, and what the function returns.
- Move the modules into
src/market_data/and the tests intotests/withgit mv, and add an__init__.py. Give each module amain()function that reads its arguments with argparse, give intraday a--dayoption, and name the data and charts folders once in files.py. - Add
[project.scripts]and[build-system]to pyproject.toml. - Run
uv sync, check the tests still pass, tryuv run --env-file .env quote AAPL, and commit.
Step 1 Add Ruff, and format
uv add --dev ruffResolved 28 packages in 250msDownloading ruff (9.9MiB) Downloaded ruffPrepared 1 package in 397msInstalled 1 package in 40ms + ruff==0.16.10
Format every file in the project, then see what changed:
uv run ruff format1 file reformatted, 10 files left unchangedgit diff --stat intraday.py | 13 +++++++++++-- pyproject.toml | 1 + uv.lock | 31 ++++++++++++++++++++++++++++++- 3 files changed, 42 insertions(+), 3 deletions(-)
Ruff reformatted intraday.py, splitting two lines longer than 88 characters. pyproject.toml and uv.lock changed when you added Ruff. Look at the changes with
git diff.Step 2 Fix what the linter finds
uv run ruff checkDTZ005 `datetime.datetime.now()` called without a `tz` argument --> watchlist.py:28:26 |26 | """Print the time, a header, then one row per symbol, from one request."""27 | snapshots = alpaca.snapshots(symbols)28 | print(f"\nQuotes at {datetime.now():%H:%M:%S}") | ^^^^^^^^^^^^^^29 | print(f"{'symbol':<6} {'last':>10} {'change':>8} {'%':>8}")30 | for symbol in symbols: |help: Pass a `datetime.timezone` object to the `tz` parameter Found 1 error.
Ruff names the rule, DTZ005, shows the line, and says how to fix it. Give the watchlist New York’s clock:
watchlist.py"""A watchlist: the latest quotes for a few symbols, refreshed every minute. Run it, and press Ctrl+C to stop: uv run --env-file .env watchlist.py""" import timefrom datetime import datetime import alpaca SYMBOLS = ["AAPL", "MSFT", "NVDA", "SPY", "QQQ"]REFRESH_SECONDS = 60 def row(symbol, snapshot): """One table row: symbol, last price, and change since the previous close.""" last = snapshot["latestTrade"]["p"] previous = snapshot["prevDailyBar"]["c"] change = last - previous return f"{symbol:<6} {last:>10.2f} {change:>+8.2f} {change / previous:>+8.2%}" def show(symbols): """Print the time in New York, a header, then one row per symbol.""" snapshots = alpaca.snapshots(symbols) print(f"\nQuotes at {datetime.now(alpaca.NEW_YORK):%H:%M:%S} New York time") print(f"{'symbol':<6} {'last':>10} {'change':>8} {'%':>8}") for symbol in symbols: print(row(symbol, snapshots[symbol])) if __name__ == "__main__": try: while True: show(SYMBOLS) time.sleep(REFRESH_SECONDS) except KeyboardInterrupt: print("\nStopped.")- Lines 26 to 28
- Ask for the time in New York, the zone alpaca.py names, and say so in the header.
uv run --env-file .env watchlist.py Quotes at 16:15:00 New York timesymbol last change %AAPL 330.27 +3.47 +1.06%MSFT 522.48 -2.62 -0.50%NVDA 185.12 +2.17 +1.19%SPY 771.53 +4.33 +0.56%QQQ 752.11 +3.21 +0.43% Stopped.
Shown for the course’s sample data. Yours shows the latest.
Check again, and commit:
uv run ruff checkAll checks passed!git commit -am "Format with Ruff, and show watchlist times in New York time"[main 4208d5e] Format with Ruff, and show watchlist times in New York time 4 files changed, 44 insertions(+), 5 deletions(-)
Step 3 Move the files into a package
A package is made in two commits: first the move, then the changes. Git doesn’t record moves. It sees a file deleted in one place and made in another, and calls it a rename when the two are mostly the same, so moving a file and rewriting it in one commit can hide the move, and the file’s history with it.
Make the two folders and move the files with
git mv, which moves a file and tells Git it moved:Windows
mkdir src/market_data, testsgit mv alpaca.py quote.py watchlist.py history.py returns.py adjust.py intraday.py src/market_data/git mv test_returns.py test_adjust.py test_intraday.py tests/
macOS and Linux
mkdir -p src/market_data testsgit mv alpaca.py quote.py watchlist.py history.py returns.py adjust.py intraday.py src/market_data/git mv test_returns.py test_adjust.py test_intraday.py tests/
Then make
src/market_data/__init__.py. A folder with this file is a package; its docstring says what the package is:src/market_data/__init__.py"""Market data from Alpaca: quotes, prices, returns and a day's minutes."""Inside a package, modules import each other by the package’s name. Four modules import alpaca; in quote.py:
src/market_data/quote.py"""Print a stock's latest quote from Alpaca, 15 minutes behind the market. Run it with a ticker, such as: uv run --env-file .env quote.py AAPL""" import sys from market_data import alpaca def describe(symbol, snapshot): """One line about a symbol: its last price, bid, ask and spread.""" last = snapshot["latestTrade"]["p"] bid = snapshot["latestQuote"]["bp"] ask = snapshot["latestQuote"]["ap"] return ( f"{symbol} last {last:.2f} bid {bid:.2f} ask {ask:.2f} " f"spread {ask - bid:.2f}" ) if __name__ == "__main__": symbol = sys.argv[1] if len(sys.argv) > 1 else "AAPL" snapshots = alpaca.snapshots([symbol]) if symbol not in snapshots: sys.exit(f"No quote for {symbol}: check the ticker.") print(describe(symbol, snapshots[symbol]))Show watchlist.py, history.py and intraday.py
src/market_data/watchlist.py"""A watchlist: the latest quotes for a few symbols, refreshed every minute. Run it, and press Ctrl+C to stop: uv run --env-file .env watchlist.py""" import timefrom datetime import datetime from market_data import alpaca SYMBOLS = ["AAPL", "MSFT", "NVDA", "SPY", "QQQ"]REFRESH_SECONDS = 60 def row(symbol, snapshot): """One table row: symbol, last price, and change since the previous close.""" last = snapshot["latestTrade"]["p"] previous = snapshot["prevDailyBar"]["c"] change = last - previous return f"{symbol:<6} {last:>10.2f} {change:>+8.2f} {change / previous:>+8.2%}" def show(symbols): """Print the time in New York, a header, then one row per symbol.""" snapshots = alpaca.snapshots(symbols) print(f"\nQuotes at {datetime.now(alpaca.NEW_YORK):%H:%M:%S} New York time") print(f"{'symbol':<6} {'last':>10} {'change':>8} {'%':>8}") for symbol in symbols: print(row(symbol, snapshots[symbol])) if __name__ == "__main__": try: while True: show(SYMBOLS) time.sleep(REFRESH_SECONDS) except KeyboardInterrupt: print("\nStopped.")src/market_data/history.py"""Download a share's daily prices since 2016, save them, and chart the close. Run it with a ticker, such as: uv run --env-file .env history.py AAPL""" import sysfrom pathlib import Path import matplotlib.pyplot as pltimport pandas as pdfrom matplotlib import ticker from market_data import alpaca # Alpaca's short names for a bar's fields, and the names this project uses.COLUMNS = {"o": "open", "h": "high", "l": "low", "c": "close", "v": "volume"} def get_history(symbol): """Every trading day's open, high, low, close and volume since 2016, adjusted for splits, oldest first, dated.""" bars = alpaca.daily_bars(symbol) prices = pd.DataFrame(bars, columns=list(COLUMNS)).rename(columns=COLUMNS) prices.index = pd.DatetimeIndex( [alpaca.day_of(bar["t"]) for bar in bars], name="date" ) return prices def chart(prices, symbol, path): """The close on every day, on a log scale, saved as a picture.""" fig, ax = plt.subplots(figsize=(10, 5)) ax.plot(prices.index, prices["close"], linewidth=1) ax.set_yscale("log") ax.yaxis.set_major_locator(ticker.LogLocator(subs=[1, 2, 5])) ax.yaxis.set_major_formatter(ticker.StrMethodFormatter("{x:,g}")) ax.yaxis.set_minor_formatter(ticker.NullFormatter()) ax.grid(alpha=0.3) ax.set_title(f"{symbol} daily close") ax.set_ylabel("USD, log scale") fig.savefig(path, dpi=120, bbox_inches="tight") if __name__ == "__main__": symbol = sys.argv[1] if len(sys.argv) > 1 else "AAPL" prices = get_history(symbol) if prices.empty: sys.exit(f"No prices for {symbol}: check the ticker.") print(prices.tail()) first, last = prices.index[0], prices.index[-1] print(f"\n{len(prices):,} days, from {first:%d %b %Y} to {last:%d %b %Y}") high = prices["close"].idxmax() print(f"highest close: {prices['close'].max():.2f} on {high:%d %b %Y}") Path("data").mkdir(exist_ok=True) Path("charts").mkdir(exist_ok=True) prices.to_csv(f"data/{symbol}.csv") chart(prices, symbol, f"charts/{symbol}.png") print(f"saved data/{symbol}.csv and charts/{symbol}.png")src/market_data/intraday.py"""A trading day's 1-minute bars: the day's bar, its VWAP and volume by hour. Run it with a ticker, such as: uv run --env-file .env intraday.py AAPL""" import sysfrom pathlib import Path import matplotlib.dates as mdatesimport matplotlib.pyplot as pltimport pandas as pdfrom matplotlib import ticker from market_data import alpaca # Alpaca's short names for a bar's fields, and the names this project uses.COLUMNS = { "o": "open", "h": "high", "l": "low", "c": "close", "v": "volume", "vw": "vwap",} def get_minutes(symbol, day=None): """A day's 1-minute bars, oldest first, labelled by their start in New York time: the latest day the symbol traded, if no day is given. Empty if Alpaca has no such symbol, or the market wasn't open that day.""" day = day or alpaca.latest_day(symbol) bars = alpaca.minute_bars(symbol, day) if day else [] minutes = pd.DataFrame(bars, columns=list(COLUMNS)).rename(columns=COLUMNS) times = pd.to_datetime([bar["t"] for bar in bars], utc=True) minutes.index = times.tz_convert(alpaca.NEW_YORK).rename("time") return minutes def day_bar(minutes): """The whole day as one bar, built from its minutes.""" return { "open": minutes["open"].iloc[0], "high": minutes["high"].max(), "low": minutes["low"].min(), "close": minutes["close"].iloc[-1], "volume": minutes["volume"].sum(), } def vwap(minutes): """The day's volume-weighted average price, from each minute's own.""" traded = (minutes["vwap"] * minutes["volume"]).sum() return traded / minutes["volume"].sum() def volume_by_hour(minutes): """The shares traded in each hour on the clock: 9 is the first half hour.""" return minutes["volume"].groupby(minutes.index.hour).sum() def chart(minutes, symbol, path): """The price and its VWAP above, each minute's volume below, saved as a picture.""" fig, (top, bottom) = plt.subplots( 2, 1, figsize=(10, 6), sharex=True, height_ratios=[3, 1] ) top.plot(minutes.index, minutes["close"], linewidth=1, label="price") top.axhline(vwap(minutes), color="tab:orange", linestyle="--", label="VWAP") top.set_title(f"{symbol} 1-minute bars, {minutes.index[0]:%d %b %Y}") top.set_ylabel("USD") top.legend() bottom.bar(minutes.index, minutes["volume"], width=1 / (24 * 60), color="gray") bottom.set_ylabel("shares") bottom.yaxis.set_major_formatter(ticker.StrMethodFormatter("{x:,.0f}")) bottom.xaxis.set_major_formatter(mdates.DateFormatter("%H:%M", tz=alpaca.NEW_YORK)) fig.savefig(path, dpi=120, bbox_inches="tight") if __name__ == "__main__": symbol = sys.argv[1] if len(sys.argv) > 1 else "AAPL" minutes = get_minutes(symbol) if minutes.empty: sys.exit(f"No minutes for {symbol}: check the ticker.") first, last = minutes.index[0], minutes.index[-1] print( f"{len(minutes)} minutes on {first:%d %b %Y}, {first:%H:%M} to {last:%H:%M}\n" ) bar = day_bar(minutes) for field in ("open", "high", "low", "close"): print(f"{field:<8}{bar[field]:.2f}") print(f"{'volume':<8}{bar['volume']:,}") print(f"{'VWAP':<8}{vwap(minutes):.2f}") hours = volume_by_hour(minutes) print("\nhour shares") for hour, shares in hours.items(): print(f"{hour:>4}{shares:>12,} {'#' * round(30 * shares / hours.max())}") Path("data").mkdir(exist_ok=True) Path("charts").mkdir(exist_ok=True) day = f"{symbol}-{first:%Y-%m-%d}" minutes.to_csv(f"data/{day}.csv") chart(minutes, symbol, f"charts/{day}.png") print(f"\nsaved data/{day}.csv and charts/{day}.png")The tests import from the package the same way:
Show the three test files
tests/test_returns.pyimport pandas as pdimport pytest from market_data.returns import ( calendar_years, daily_returns, total_return, yearly_growth,) def test_daily_returns(): close = pd.Series([100.0, 110.0, 99.0]) assert daily_returns(close).tolist() == pytest.approx([0.10, -0.10]) def test_total_return_compounds(): close = pd.Series([100.0, 110.0, 99.0]) assert total_return(close) == pytest.approx(-0.01) def test_yearly_growth_compounds_back_to_the_total(): dates = pd.to_datetime(["2020-01-01", "2022-01-01"]) close = pd.Series([100.0, 200.0], index=dates) years = 731 / 365.25 # 2020 had 366 days, 2021 had 365 assert (1 + yearly_growth(close)) ** years == pytest.approx(2.0) def test_calendar_years_start_from_the_year_before(): dates = pd.to_datetime(["2024-06-03", "2024-12-31", "2025-06-02", "2025-12-31"]) close = pd.Series([90.0, 100.0, 130.0, 120.0], index=dates) years = calendar_years(close) assert years.index.year.tolist() == [2025] assert years.tolist() == pytest.approx([0.20])tests/test_adjust.pyimport pandas as pdimport pytest from market_data.adjust import adjust, find_splits, total_returns DAYS = pd.to_datetime(["2026-03-02", "2026-03-03", "2026-03-04"]) def raw_prices(): """Three days of a share that split 2 for 1 on the second day.""" return pd.DataFrame( {"close": [100.0, 51.0, 52.0], "volume": [1000, 2200, 1800], "dividend": 0.0}, index=DAYS, ) def test_find_splits_finds_a_2_for_1(): assert find_splits(raw_prices()["close"]) == {DAYS[1]: 2} def test_find_splits_ignores_an_ordinary_fall(): close = pd.Series([100.0, 90.0, 95.0], index=DAYS) assert find_splits(close) == {} def test_adjust_divides_prices_and_multiplies_volume_before_the_split(): adjusted = adjust(raw_prices(), {DAYS[1]: 2}) assert adjusted["close"].tolist() == [50.0, 51.0, 52.0] assert adjusted["volume"].tolist() == [2000, 2200, 1800] def test_adjust_leaves_the_raw_prices_alone(): raw = raw_prices() adjust(raw, {DAYS[1]: 2}) assert raw["close"].tolist() == [100.0, 51.0, 52.0] def test_total_returns_count_the_dividend(): close = pd.Series([50.0, 49.75], index=DAYS[:2]) dividend = pd.Series([0.0, 0.5], index=DAYS[:2]) assert total_returns(close, dividend).tolist() == pytest.approx([0.005])tests/test_intraday.pyimport pandas as pdimport pytest from market_data.intraday import day_bar, volume_by_hour, vwap TIMES = pd.to_datetime(["2026-10-06 09:30", "2026-10-06 09:31", "2026-10-06 10:00"]) def three_minutes(): """Three minutes, two in the first half hour and one after 10:00.""" return pd.DataFrame( { "open": [10.0, 11.0, 12.0], "high": [11.0, 12.0, 13.0], "low": [9.0, 10.0, 11.0], "close": [10.0, 11.0, 12.0], "volume": [100, 100, 200], "vwap": [10.2, 11.1, 12.0], }, index=TIMES, ) def test_day_bar_is_built_from_its_minutes(): bar = day_bar(three_minutes()) assert bar == {"open": 10.0, "high": 13.0, "low": 9.0, "close": 12.0, "volume": 400} def test_vwap_weights_each_minute_by_its_volume(): # (10.2 × 100 + 11.1 × 100 + 12 × 200) ÷ 400 = 4530 ÷ 400 = 11.325. assert vwap(three_minutes()) == pytest.approx(11.325) def test_volume_by_hour_adds_up_each_hour(): hours = volume_by_hour(three_minutes()) assert hours.to_dict() == {9: 200, 10: 200}Add how to build the package to the end of pyproject.toml:
pyproject.toml[build-system]requires = ["uv_build>=0.12.23,<0.13.0"]build-backend = "uv_build"- Lines 1 to 3
- How to build the package: with uv_build, uv’s own builder, in the versions shown. uv writes these lines for every new package.
Install the package into the project with
uv sync, run the tests from their new home, and commit the move on its own:uv syncResolved 28 packages in 10ms Building market-data @ file:///home/you/market-data Built market-data @ file:///home/you/market-dataPrepared 1 package in 17msInstalled 1 package in 1ms + market-data==0.1.0 (from file:///home/you/market-data)uv run pytest============================= test session starts ==============================platform linux -- Python 3.14.8, pytest-9.1.1, pluggy-1.6.0rootdir: /home/you/market-dataconfigfile: pyproject.tomlplugins: anyio-4.15.1collected 12 items tests/test_adjust.py ..... [ 41%]tests/test_intraday.py ... [ 66%]tests/test_returns.py .... [100%] ============================== 12 passed in 1.02s ==============================git add .git commit -m "Move the code into a package"[main 261ffe9] Move the code into a package 13 files changed, 18 insertions(+), 8 deletions(-) create mode 100644 src/market_data/__init__.py rename adjust.py => src/market_data/adjust.py (100%) rename alpaca.py => src/market_data/alpaca.py (100%) rename history.py => src/market_data/history.py (98%) rename intraday.py => src/market_data/intraday.py (99%) rename quote.py => src/market_data/quote.py (96%) rename returns.py => src/market_data/returns.py (100%) rename watchlist.py => src/market_data/watchlist.py (97%) rename test_adjust.py => tests/test_adjust.py (94%) rename test_intraday.py => tests/test_intraday.py (94%) rename test_returns.py => tests/test_returns.py (89%)
Step 4 Type hints, and commands with argparse
Now the changes. Each module gets type hints, and its code under
if __name__moves into a function calledmain, for its command to run, which reads the command’s arguments with argparse. quote.py:src/market_data/quote.py"""Print a symbol's latest quote: last price, bid, ask and spread. Usage: uv run --env-file .env quote AAPL""" import argparseimport sysfrom typing import Any from market_data import alpaca def describe(symbol: str, snapshot: dict[str, Any]) -> str: """A quote on one line: the latest trade's price, the bid, the ask and the spread.""" last = snapshot["latestTrade"]["p"] bid = snapshot["latestQuote"]["bp"] ask = snapshot["latestQuote"]["ap"] return ( f"{symbol} last {last:.2f} bid {bid:.2f} ask {ask:.2f} " f"spread {ask - bid:.2f}" ) def main() -> None: parser = argparse.ArgumentParser(description="Print a symbol's latest quote.") parser.add_argument( "symbol", nargs="?", default="AAPL", help="ticker symbol (default: AAPL)" ) symbol = parser.parse_args().symbol snapshots = alpaca.snapshots([symbol]) if symbol not in snapshots: sys.exit(f"No quote for {symbol}: check the ticker.") print(describe(symbol, snapshots[symbol])) if __name__ == "__main__": main()- Line 5
- The docstring gives the new command.
- Line 8
argparsecomes with Python and reads a command’s arguments.- Line 15
- A symbol and its snapshot in, a line of text out.
dict[str, Any]is a dictionary with text keys and values of any type, fromtyping: JSON can hold anything. - Lines 26 to 35
mainis whatuv run quotecalls, and-> Nonesays it returns nothing. The parser takes one argument, the symbol:nargs="?"makes it optional, with AAPL as its default.- Lines 38 to 39
- Running the file itself still works: it calls main.
alpaca.py gets its hints:
src/market_data/alpaca.py"""Alpaca's market data: snapshots, daily bars and 1-minute bars. Snapshots are 15 minutes behind the market and cover every US exchange. The freeplan has bars since 2016, up to 15 minutes ago. The data is for personal use.""" import osfrom datetime import date, datetime, time, timedeltafrom functools import lru_cachefrom typing import Anyfrom zoneinfo import ZoneInfo import httpx2 BASE_URL = "https://data.alpaca.markets"# The market's time zone. Alpaca gives every time in UTC.NEW_YORK = ZoneInfo("America/New_York")# The free plan's full-market data ends 15 minutes before now.DELAY = timedelta(minutes=15) @lru_cachedef client() -> httpx2.Client: """One client for every request to Alpaca, made the first time it is needed: it keeps its connection open between requests and sends your keys with each.""" keys = { "APCA-API-KEY-ID": os.environ["APCA_API_KEY_ID"], "APCA-API-SECRET-KEY": os.environ["APCA_API_SECRET_KEY"], } return httpx2.Client(base_url=BASE_URL, headers=keys, timeout=10) def get(path: str, params: dict[str, Any]) -> Any: """GET a path with its query and return the JSON.""" response = client().get(path, params=params) response.raise_for_status() return response.json() def snapshots(symbols: list[str]) -> dict[str, Any]: """Each symbol's latest trade, quote and daily bars, 15 minutes behind.""" query = {"symbols": ",".join(symbols), "feed": "delayed_sip"} found: dict[str, Any] = get("/v2/stocks/snapshots", query) return found def bars(symbol: str, query: dict[str, Any]) -> list[dict[str, Any]]: """A symbol's bars, oldest first, following Alpaca's pages to the last.""" query = {"symbols": symbol, "feed": "sip", "limit": 10000, **query} found: list[dict[str, Any]] = [] while True: page = get("/v2/stocks/bars", query) found += page["bars"].get(symbol, []) if not page["next_page_token"]: return found query["page_token"] = page["next_page_token"] def day_of(timestamp: str) -> date: """The New York date of one of Alpaca's UTC times.""" return datetime.fromisoformat(timestamp).astimezone(NEW_YORK).date() def daily_bars(symbol: str) -> list[dict[str, Any]]: """Every trading day's bar since 2016, adjusted for splits.""" query = {"timeframe": "1Day", "start": "2016-01-01", "adjustment": "split"} return bars(symbol, query) def latest_day(symbol: str) -> date | None: """The latest day the symbol traded: today once it has, or the last day it did. None if Alpaca has no such symbol.""" snapshot = snapshots([symbol]).get(symbol) return day_of(snapshot["dailyBar"]["t"]) if snapshot else None def minute_bars(symbol: str, day: date) -> list[dict[str, Any]]: """A day's 1-minute bars, from 09:30 New York time to the last minute before 16:00, or to 15 minutes ago if that is sooner. Each is labelled by its start.""" opening = datetime.combine(day, time(9, 30), NEW_YORK) last = datetime.combine(day, time(15, 59), NEW_YORK) end = min(last, datetime.now(NEW_YORK) - DELAY) # A day still to come has no minutes yet, and Alpaca refuses to be asked for them. if end < opening: return [] query = {"timeframe": "1Min", "start": opening.isoformat(), "end": end.isoformat()} return bars(symbol, query)- Line 8
date, a calendar date, joins the imports for the hints, withAnyfrom Python’s typing module.- Line 23
clientreturns an httpx2 client.- Line 33
- JSON can hold anything, so
getreturnsAny. - Line 43
- A hint on a name says what this JSON holds, so the function’s own hint is true: a dictionary of snapshots by symbol.
- Line 70
date | Nonesays it returns a date, or None for a ticker Alpaca doesn’t know.- Line 77
- A symbol and a date in, a list of bars out, each a dictionary.
Every command that saves or reads prices uses the same two folders, so they are named once, in a new file, files.py:
src/market_data/files.py"""Where commands save downloaded prices and charts: folders in the one they run from. Both are in .gitignore. Alpaca's data is for personal use, so it stays on this computer.""" from pathlib import Path DATA = Path("data")CHARTS = Path("charts")The other five modules, finished:
Show the other five modules
src/market_data/watchlist.py"""The watchlist, and a table of its quotes refreshed every minute. Usage: uv run --env-file .env watchlist Press Ctrl+C to stop.""" import argparseimport timefrom datetime import datetimefrom typing import Any from market_data import alpaca # Every command that works on the watchlist reads it from here.SYMBOLS = ["AAPL", "MSFT", "NVDA", "SPY", "QQQ"] def row(symbol: str, snapshot: dict[str, Any]) -> str: """One row: symbol, last price, and change since the previous close.""" last = snapshot["latestTrade"]["p"] previous = snapshot["prevDailyBar"]["c"] change = last - previous return f"{symbol:<6} {last:>10.2f} {change:>+8.2f} {change / previous:>+8.2%}" def show(symbols: list[str]) -> None: """The New York time, a header, and a row for each symbol, from one request.""" snapshots = alpaca.snapshots(symbols) print(f"\nQuotes at {datetime.now(alpaca.NEW_YORK):%H:%M:%S} New York time") print(f"{'symbol':<6} {'last':>10} {'change':>8} {'%':>8}") for symbol in symbols: print(row(symbol, snapshots[symbol])) def main() -> None: parser = argparse.ArgumentParser( description="Show the watchlist's quotes, refreshed every minute." ) parser.add_argument( "--every", type=int, default=60, help="seconds between refreshes (default: 60)" ) args = parser.parse_args() try: while True: show(SYMBOLS) time.sleep(args.every) except KeyboardInterrupt: print("\nStopped.") if __name__ == "__main__": main()src/market_data/history.py"""Download a symbol's daily bars since 2016, save them, and chart the close. Usage: uv run --env-file .env history AAPL""" import argparseimport sys import matplotlib.pyplot as pltimport pandas as pdfrom matplotlib import ticker from market_data import alpacafrom market_data.files import CHARTS, DATA # Alpaca's short names for a bar's fields, and the names this project uses.COLUMNS = {"o": "open", "h": "high", "l": "low", "c": "close", "v": "volume"} def get_history(symbol: str) -> pd.DataFrame: """Every trading day's open, high, low, close and volume since 2016, adjusted for splits, oldest first, dated.""" bars = alpaca.daily_bars(symbol) prices = pd.DataFrame(bars, columns=list(COLUMNS)).rename(columns=COLUMNS) prices.index = pd.DatetimeIndex( [alpaca.day_of(bar["t"]) for bar in bars], name="date" ) return prices def chart(prices: pd.DataFrame, symbol: str, path: str) -> None: """The daily close on a log scale, saved as a PNG.""" fig, ax = plt.subplots(figsize=(10, 5)) ax.plot(prices.index, prices["close"], linewidth=1) ax.set_yscale("log") ax.yaxis.set_major_locator(ticker.LogLocator(subs=[1, 2, 5])) ax.yaxis.set_major_formatter(ticker.StrMethodFormatter("{x:,g}")) ax.yaxis.set_minor_formatter(ticker.NullFormatter()) ax.grid(alpha=0.3) ax.set_title(f"{symbol} daily close") ax.set_ylabel("USD, log scale") fig.savefig(path, dpi=120, bbox_inches="tight") def main() -> None: parser = argparse.ArgumentParser( description="Download, save and chart a symbol's daily bars." ) parser.add_argument( "symbol", nargs="?", default="AAPL", help="ticker symbol (default: AAPL)" ) symbol = parser.parse_args().symbol prices = get_history(symbol) if prices.empty: sys.exit(f"No prices for {symbol}: check the ticker.") print(prices.tail()) print( f"\n{len(prices):,} days, {prices.index[0]:%d %b %Y} to {prices.index[-1]:%d %b %Y}" ) best = prices["close"].idxmax() print(f"highest close: {prices['close'].max():.2f} on {best:%d %b %Y}") DATA.mkdir(exist_ok=True) CHARTS.mkdir(exist_ok=True) prices.to_csv(DATA / f"{symbol}.csv") chart(prices, symbol, str(CHARTS / f"{symbol}.png")) print(f"saved {DATA / symbol}.csv and {CHARTS / symbol}.png") if __name__ == "__main__": main()src/market_data/returns.py"""Daily, total and yearly returns of a symbol, from the prices history saved. Usage: uv run returns AAPL""" import argparse import pandas as pd from market_data.files import DATA def load(symbol: str) -> pd.DataFrame: """The prices history saved, dated.""" return pd.read_csv(DATA / f"{symbol}.csv", index_col="date", parse_dates=True) def daily_returns(close: pd.Series) -> pd.Series: """Each day's return: the close over the previous close, minus 1.""" return close.pct_change().dropna() def total_return(close: pd.Series) -> float: """The period's return: the last close over the first, minus 1.""" return float(close.iloc[-1] / close.iloc[0] - 1) def yearly_growth(close: pd.Series) -> float: """The compound annual growth rate: the yearly return that compounds to the total.""" years = (close.index[-1] - close.index[0]).days / 365.25 return float((close.iloc[-1] / close.iloc[0]) ** (1 / years) - 1) def calendar_years(close: pd.Series) -> pd.Series: """Each calendar year's return, from one year's last close to the next.""" return close.resample("YE").last().pct_change().dropna() def main() -> None: parser = argparse.ArgumentParser( description="Print a symbol's returns from its saved prices." ) parser.add_argument( "symbol", nargs="?", default="AAPL", help="ticker symbol (default: AAPL)" ) close = load(parser.parse_args().symbol)["close"] daily = daily_returns(close) print(f"best day: {daily.max():+.2%} on {daily.idxmax():%d %b %Y}") print(f"worst day: {daily.min():+.2%} on {daily.idxmin():%d %b %Y}") print(f"from {close.iloc[0]:.2f} to {close.iloc[-1]:.2f}") print(f"total return: {total_return(close):+,.1%}") print(f"growth a year, compounded: {yearly_growth(close):+.1%}") print("\nyear return") for year, r in calendar_years(close).items(): print(f"{year:%Y} {r:+7.1%}") if __name__ == "__main__": main()src/market_data/adjust.py"""Find splits in raw prices, adjust for them, and count dividends in. Reads the raw sample in data/split-sample.csv and your prices in data/AAPL.csv. Usage: uv run adjust""" import math import pandas as pd from market_data.files import DATAfrom market_data.returns import total_return # A 2-for-1 split halves the price, and the stock may rise a little that day too.# A fall of more than 40% in a day is almost always a split, not a crash.SPLIT_MOVE = -0.4 def find_splits(close: pd.Series) -> dict[pd.Timestamp, int]: """Days the close fell by more than 40%, each with its split ratio.""" returns = close.pct_change() days = returns[returns < SPLIT_MOVE].index return {day: round(close.shift(1)[day] / close[day]) for day in days} def adjust(prices: pd.DataFrame, splits: dict[pd.Timestamp, int]) -> pd.DataFrame: """Divide each price and dividend before a split by its ratio; multiply volume.""" adjusted = prices.copy() for day, ratio in splits.items(): before = adjusted.index < day adjusted.loc[before, ["close", "dividend"]] /= ratio adjusted.loc[before, "volume"] *= ratio return adjusted def total_returns(close: pd.Series, dividend: pd.Series) -> pd.Series: """Each day's return with that day's dividend included.""" return ((close + dividend) / close.shift(1) - 1).dropna() def main() -> None: raw = pd.read_csv(DATA / "split-sample.csv", index_col="date", parse_dates=True) splits = find_splits(raw["close"]) for day, ratio in splits.items(): print(f"split on {day:%d %b %Y}: {ratio} for 1") prices = adjust(raw, splits) close = prices["close"] total = math.prod(1 + total_returns(close, prices["dividend"])) - 1 print(f"from {close.iloc[0]:.4f} to {close.iloc[-1]:.4f}") print(f"price return: {total_return(close):+.2%}") print(f"total return, with dividend: {total:+.2%}") mine = pd.read_csv(DATA / "AAPL.csv", index_col="date", parse_dates=True) print(f"splits in {DATA / 'AAPL.csv'}: {len(find_splits(mine['close']))}") if __name__ == "__main__": main()src/market_data/intraday.py"""A trading day's 1-minute bars: the day's bar, its VWAP and volume by hour. Usage: uv run --env-file .env intraday AAPL uv run --env-file .env intraday AAPL --day 2026-10-05 With no day, it shows the latest day the symbol traded.""" import argparseimport sysfrom datetime import date import matplotlib.dates as mdatesimport matplotlib.pyplot as pltimport pandas as pdfrom matplotlib import ticker from market_data import alpacafrom market_data.files import CHARTS, DATA # Alpaca's short names for a bar's fields, and the names this project uses.COLUMNS = { "o": "open", "h": "high", "l": "low", "c": "close", "v": "volume", "vw": "vwap",} def get_minutes(symbol: str, day: date | None = None) -> pd.DataFrame: """A day's 1-minute bars, oldest first, labelled by their start in New York time: the latest day the symbol traded, if no day is given. Empty if Alpaca has no such symbol, or the market wasn't open that day.""" day = day or alpaca.latest_day(symbol) bars = alpaca.minute_bars(symbol, day) if day else [] minutes = pd.DataFrame(bars, columns=list(COLUMNS)).rename(columns=COLUMNS) times = pd.to_datetime([bar["t"] for bar in bars], utc=True) minutes.index = times.tz_convert(alpaca.NEW_YORK).rename("time") return minutes def day_bar(minutes: pd.DataFrame) -> dict[str, float]: """The day as one bar, built from its minutes.""" return { "open": float(minutes["open"].iloc[0]), "high": float(minutes["high"].max()), "low": float(minutes["low"].min()), "close": float(minutes["close"].iloc[-1]), "volume": float(minutes["volume"].sum()), } def vwap(minutes: pd.DataFrame) -> float: """The day's volume-weighted average price, from each minute's own.""" traded = (minutes["vwap"] * minutes["volume"]).sum() return float(traded / minutes["volume"].sum()) def volume_by_hour(minutes: pd.DataFrame) -> pd.Series: """Shares traded in each clock hour. Hour 9 is the first half hour, 9:30 to 10:00.""" return minutes["volume"].groupby(pd.DatetimeIndex(minutes.index).hour).sum() def chart(minutes: pd.DataFrame, symbol: str, path: str) -> None: """Price and VWAP above, volume below, saved as a PNG.""" fig, (top, bottom) = plt.subplots( 2, 1, figsize=(10, 6), sharex=True, height_ratios=[3, 1] ) top.plot(minutes.index, minutes["close"], linewidth=1, label="price") top.axhline(vwap(minutes), color="tab:orange", linestyle="--", label="VWAP") top.set_title(f"{symbol} 1-minute bars, {minutes.index[0]:%d %b %Y}") top.set_ylabel("USD") top.legend() bottom.bar(minutes.index, minutes["volume"], width=1 / (24 * 60), color="gray") bottom.set_ylabel("shares") bottom.yaxis.set_major_formatter(ticker.StrMethodFormatter("{x:,.0f}")) bottom.xaxis.set_major_formatter(mdates.DateFormatter("%H:%M", tz=alpaca.NEW_YORK)) fig.savefig(path, dpi=120, bbox_inches="tight") def main() -> None: parser = argparse.ArgumentParser( description="Summarise and chart a trading day's 1-minute bars." ) parser.add_argument( "symbol", nargs="?", default="AAPL", help="ticker symbol (default: AAPL)" ) parser.add_argument( "--day", type=date.fromisoformat, help="YYYY-MM-DD (default: the latest)" ) args = parser.parse_args() symbol = args.symbol minutes = get_minutes(symbol, args.day) if minutes.empty: sys.exit(f"No minutes for {symbol} that day: check the ticker and the day.") first, last = minutes.index[0], minutes.index[-1] print( f"{len(minutes)} minutes on {first:%d %b %Y}, {first:%H:%M} to {last:%H:%M}\n" ) bar = day_bar(minutes) for field in ("open", "high", "low", "close"): print(f"{field:<8}{bar[field]:.2f}") print(f"{'volume':<8}{bar['volume']:,.0f}") print(f"{'VWAP':<8}{vwap(minutes):.2f}") hours = volume_by_hour(minutes) print("\nhour shares") for hour, shares in hours.items(): print(f"{hour:>4}{shares:>12,} {'#' * round(30 * shares / hours.max())}") DATA.mkdir(exist_ok=True) CHARTS.mkdir(exist_ok=True) day = f"{symbol}-{first:%Y-%m-%d}" minutes.to_csv(DATA / f"{day}.csv") chart(minutes, symbol, str(CHARTS / f"{day}.png")) print(f"\nsaved {DATA / day}.csv and {CHARTS / day}.png") if __name__ == "__main__": main()adjust.py now works out its price return with returns.py’s
total_return, and its total return withmath.prod, which multiplies every value in a list: one calculation, written once.Step 5 The commands
Add the commands to the end of pyproject.toml:
pyproject.toml[project.scripts]quote = "market_data.quote:main"watchlist = "market_data.watchlist:main"history = "market_data.history:main"returns = "market_data.returns:main"adjust = "market_data.adjust:main"intraday = "market_data.intraday:main"- Lines 1 to 7
- Each line is a command and the function it runs:
quoterunsmainin market_data/quote.py.
Install them with
uv sync, and ask a command for its help:uv syncResolved 28 packages in 1ms Building market-data @ file:///home/you/market-data Built market-data @ file:///home/you/market-dataPrepared 1 package in 41msUninstalled 1 package in 0.47msInstalled 1 package in 2ms ~ market-data==0.1.0 (from file:///home/you/market-data)uv run quote --helpusage: quote [-h] [symbol] Print a symbol's latest quote. positional arguments: symbol ticker symbol (default: AAPL) options: -h, --help show this help message and exit
argparse wrote the help from the parser: how to call the command, its argument, and its description. Now run it:
uv run --env-file .env quote AAPLAAPL last 330.27 bid 330.25 ask 330.30 spread 0.05
Shown for the course’s sample data. Yours shows the latest.
intraday has a
--dayoption now, for any day since 2016. Ask for a day the market was closed, such as a Saturday:uv run --env-file .env intraday AAPL --day 2026-10-03No minutes for AAPL that day: check the ticker and the day.
Shown for the course’s sample data. Yours shows the latest.
There are no minutes that day, so the command says so and stops. A day still to come gives the same answer.
Step 6 Commit your work
uv run pytest============================= test session starts ==============================platform linux -- Python 3.14.8, pytest-9.1.1, pluggy-1.6.0rootdir: /home/you/market-dataconfigfile: pyproject.tomlplugins: anyio-4.15.1collected 12 items tests/test_adjust.py ..... [ 41%]tests/test_intraday.py ... [ 66%]tests/test_returns.py .... [100%] ============================== 12 passed in 0.82s ==============================git status --short M pyproject.toml M src/market_data/adjust.py M src/market_data/alpaca.py M src/market_data/history.py M src/market_data/intraday.py M src/market_data/quote.py M src/market_data/returns.py M src/market_data/watchlist.py?? src/market_data/files.pygit add .git commit -m "Add type hints and command-line options"[main 30eeaa4] Add type hints and command-line options 9 files changed, 208 insertions(+), 112 deletions(-) create mode 100644 src/market_data/files.pygit log --oneline30eeaa4 Add type hints and command-line options261ffe9 Move the code into a package4208d5e Format with Ruff, and show watchlist times in New York timed33b284 Test returns, splits and the day's minutes, and fix the split finder68d77cf Add intraday bars: day bar, VWAP and volume by hour76128d9 Find splits and adjust prices for them7db9292 Measure daily, total and yearly returnsea85b23 Add an Alpaca client, and save and chart daily prices8e422fa Revert "Add Amazon to the watchlist"3e9f036 Add Amazon to the watchlist0ce6a95 Print a quote and a watchlist
The log shows the two commits, the move and then the changes.
git log --follow src/market_data/quote.pyfollows a file’s history back past the move.
Walkthrough
The whole solution, explained line by line. Open it once you have tried.
Show the walkthrough
The finished intraday.py, in the package:
"""A trading day's 1-minute bars: the day's bar, its VWAP and volume by hour. Usage: uv run --env-file .env intraday AAPL uv run --env-file .env intraday AAPL --day 2026-10-05 With no day, it shows the latest day the symbol traded.""" import argparseimport sysfrom datetime import date import matplotlib.dates as mdatesimport matplotlib.pyplot as pltimport pandas as pdfrom matplotlib import ticker from market_data import alpacafrom market_data.files import CHARTS, DATA # Alpaca's short names for a bar's fields, and the names this project uses.COLUMNS = { "o": "open", "h": "high", "l": "low", "c": "close", "v": "volume", "vw": "vwap",} def get_minutes(symbol: str, day: date | None = None) -> pd.DataFrame: """A day's 1-minute bars, oldest first, labelled by their start in New York time: the latest day the symbol traded, if no day is given. Empty if Alpaca has no such symbol, or the market wasn't open that day.""" day = day or alpaca.latest_day(symbol) bars = alpaca.minute_bars(symbol, day) if day else [] minutes = pd.DataFrame(bars, columns=list(COLUMNS)).rename(columns=COLUMNS) times = pd.to_datetime([bar["t"] for bar in bars], utc=True) minutes.index = times.tz_convert(alpaca.NEW_YORK).rename("time") return minutes def day_bar(minutes: pd.DataFrame) -> dict[str, float]: """The day as one bar, built from its minutes.""" return { "open": float(minutes["open"].iloc[0]), "high": float(minutes["high"].max()), "low": float(minutes["low"].min()), "close": float(minutes["close"].iloc[-1]), "volume": float(minutes["volume"].sum()), } def vwap(minutes: pd.DataFrame) -> float: """The day's volume-weighted average price, from each minute's own.""" traded = (minutes["vwap"] * minutes["volume"]).sum() return float(traded / minutes["volume"].sum()) def volume_by_hour(minutes: pd.DataFrame) -> pd.Series: """Shares traded in each clock hour. Hour 9 is the first half hour, 9:30 to 10:00.""" return minutes["volume"].groupby(pd.DatetimeIndex(minutes.index).hour).sum() def chart(minutes: pd.DataFrame, symbol: str, path: str) -> None: """Price and VWAP above, volume below, saved as a PNG.""" fig, (top, bottom) = plt.subplots( 2, 1, figsize=(10, 6), sharex=True, height_ratios=[3, 1] ) top.plot(minutes.index, minutes["close"], linewidth=1, label="price") top.axhline(vwap(minutes), color="tab:orange", linestyle="--", label="VWAP") top.set_title(f"{symbol} 1-minute bars, {minutes.index[0]:%d %b %Y}") top.set_ylabel("USD") top.legend() bottom.bar(minutes.index, minutes["volume"], width=1 / (24 * 60), color="gray") bottom.set_ylabel("shares") bottom.yaxis.set_major_formatter(ticker.StrMethodFormatter("{x:,.0f}")) bottom.xaxis.set_major_formatter(mdates.DateFormatter("%H:%M", tz=alpaca.NEW_YORK)) fig.savefig(path, dpi=120, bbox_inches="tight") def main() -> None: parser = argparse.ArgumentParser( description="Summarise and chart a trading day's 1-minute bars." ) parser.add_argument( "symbol", nargs="?", default="AAPL", help="ticker symbol (default: AAPL)" ) parser.add_argument( "--day", type=date.fromisoformat, help="YYYY-MM-DD (default: the latest)" ) args = parser.parse_args() symbol = args.symbol minutes = get_minutes(symbol, args.day) if minutes.empty: sys.exit(f"No minutes for {symbol} that day: check the ticker and the day.") first, last = minutes.index[0], minutes.index[-1] print( f"{len(minutes)} minutes on {first:%d %b %Y}, {first:%H:%M} to {last:%H:%M}\n" ) bar = day_bar(minutes) for field in ("open", "high", "low", "close"): print(f"{field:<8}{bar[field]:.2f}") print(f"{'volume':<8}{bar['volume']:,.0f}") print(f"{'VWAP':<8}{vwap(minutes):.2f}") hours = volume_by_hour(minutes) print("\nhour shares") for hour, shares in hours.items(): print(f"{hour:>4}{shares:>12,} {'#' * round(30 * shares / hours.max())}") DATA.mkdir(exist_ok=True) CHARTS.mkdir(exist_ok=True) day = f"{symbol}-{first:%Y-%m-%d}" minutes.to_csv(DATA / f"{day}.csv") chart(minutes, symbol, str(CHARTS / f"{day}.png")) print(f"\nsaved {DATA / day}.csv and {CHARTS / day}.png") if __name__ == "__main__": main()- Lines 24 to 31
- Alpaca’s short names, and the names this project uses.
- Lines 34 to 43
- Fetch a day’s minutes from the Alpaca client, the latest if no day is given, keep the six columns renamed, and index them by their start in New York time.
- Lines 46 to 54
- The day’s bar from its minutes.
- Lines 57 to 60
- The day’s VWAP from each minute’s VWAP and volume.
- Lines 63 to 65
- The shares traded in each hour on the clock.
- Lines 68 to 82
- The price and its VWAP above, the volume below, saved as a picture.
- Lines 85 to 118
- Read the symbol and the day, fetch its minutes, print its bar, VWAP and hours, and save the minutes and the chart.
The finished test_adjust.py:
import pandas as pdimport pytest from market_data.adjust import adjust, find_splits, total_returns DAYS = pd.to_datetime(["2026-03-02", "2026-03-03", "2026-03-04"]) def raw_prices(): """Three days of a share that split 2 for 1 on the second day.""" return pd.DataFrame( {"close": [100.0, 51.0, 52.0], "volume": [1000, 2200, 1800], "dividend": 0.0}, index=DAYS, ) def test_find_splits_finds_a_2_for_1(): assert find_splits(raw_prices()["close"]) == {DAYS[1]: 2} def test_find_splits_ignores_an_ordinary_fall(): close = pd.Series([100.0, 90.0, 95.0], index=DAYS) assert find_splits(close) == {} def test_adjust_divides_prices_and_multiplies_volume_before_the_split(): adjusted = adjust(raw_prices(), {DAYS[1]: 2}) assert adjusted["close"].tolist() == [50.0, 51.0, 52.0] assert adjusted["volume"].tolist() == [2000, 2200, 1800] def test_adjust_leaves_the_raw_prices_alone(): raw = raw_prices() adjust(raw, {DAYS[1]: 2}) assert raw["close"].tolist() == [100.0, 51.0, 52.0] def test_total_returns_count_the_dividend(): close = pd.Series([50.0, 49.75], index=DAYS[:2]) dividend = pd.Series([0.0, 0.5], index=DAYS[:2]) assert total_returns(close, dividend).tolist() == pytest.approx([0.005])- Line 4
- The functions under test, from the package.
- Lines 9 to 13
- A fresh made-up table for each test: a 2-for-1 split on a day the share rose 2%.
- Lines 17 to 18
- The split is found, with its ratio, on its day.
- Lines 26 to 35
- Adjusting divides prices and multiplies volume before the split, and leaves the raw table alone.
- Lines 38 to 41
- The dividend is counted in the day’s return.
Go deeper
- The shell, git and a debuggerBranches in Git, paths through folders in the shell, and a debugger that stops inside your code: the tools after today’s.
Check yourself
Questions an interviewer could ask about today’s work.
01What is VWAP, and why do traders watch it?Show answer
The volume-weighted average price: the average price of every share traded in the day, each minute counted by its volume. Traders judge their own buying and selling against it. Buying below the day’s VWAP means you paid less than the average share cost that day.
02Your test compares 0.1 + 0.2 with 0.3 using == and fails. Why, and what do you do?Show answer
Most decimals have no exact binary form, so 0.1 + 0.2 is 0.30000000000000004. Compare decimals within a tolerance instead: pytest.approx(0.3) accepts a difference of up to a millionth of 0.3.
03Why shouldn’t a test download today’s prices?Show answer
Its answer would change with the market, so it could fail when the code is right, or pass when it is wrong. It would also be slow and need the internet and your keys. Tests use small made-up data whose answers are worked out on paper.
04What is the difference between a formatter and a linter?Show answer
A formatter changes how code is laid out without changing what it does, so every file reads the same. A linter changes nothing: it reports code that runs but is likely wrong, such as an unused import or a time with no time zone.
05Your split finder looks for one-day falls of more than 50%. What does it miss, and how would you have found out?Show answer
A 2-for-1 split on any day the share also rose: the price halves, but the rise makes the fall less than half. A test of exactly that case fails, which is why the first test should be the case you are least sure of.
Learning points
- A day’s minute bars give back its daily bar: the first open, the highest high, the lowest low, the last close, and all the volume.
- Alpaca gives every time in UTC, each bar labelled by its start. Convert to New York time, the market’s, before reading a clock.
- VWAP is the dollars traded ÷ the shares traded: each minute’s own VWAP weighted by its volume. It is the price traders judge their buying against.
- A test runs code on made-up inputs with answers worked out on paper. Compare decimals with pytest.approx.
- Ruff formats code one way and finds likely mistakes. Run it before each commit.
- A package keeps the code in src/, imports by the package’s name, and runs its parts as commands, such as uv run --env-file .env quote AAPL.
Keep going
When a test fails
Today’s red F was the most useful line you have printed so far: it found a bug before it could cost anything. Tests that never fail are either testing nothing or not yet testing the hard cases.
Moving files into a package can break imports in ways that look mysterious. When one fails, read the error’s last line: it names the module Python couldn’t find. Then check that uv sync ran, and that the import uses the package’s name.
Ship it
Run uv run pytest and uv run ruff check one last time: 12 tests passed, and all checks passed. git log --oneline lists today’s commits above Days 1 and 2’s.
Tomorrow your repository goes on GitHub, and you start saving prices in a database.
For education only. Not investment advice. Terms of Use